

What are the Kanban Metrics?
In the software, Kanban aims to accelerate the workflow in the value chain. For this purpose, process steps are determined, flow is visualized, operation rules are determined, flow is monitored, bottlenecks are determined and actions are taken to overcome them and improvements are made. To evaluate these improvements, we need to compare the values before and after the improvement. For this purpose, various metrics are used in Kanban. Commonly used ones are listed below.
Lead Time
It is the time from the moment a job is decided to be done and enter the backlog (to-do column) to the moment it is finished. When we consider the Task Board, we can say that it is the time from the moment a job enters the To-Do column to the moment it comes to the Finished column. That is the total time it takes for a job to go from the to-do column to analysis, from analysis to ux design, from ux design to coding, from coding to test, from test to live.
Cycle Time
It is the time from the moment a job starts to be done to the moment it is completed. In other words, it is the time interval from the time coding starts to the time it goes live.
Average cycle time and lead time can be calculated for different job types. Thus, the average time for the delivery of such a job can be estimated. They are used for measuring how fast the work progresses in the current process and in which steps the process slows down. The speed of access to the market can be calculated using lead time. In addition, an evaluation can be made based on end dates according to the previous data. It can be observed if there is a delay by comparing the delivery times of similar previous jobs. By reviewing the times in different steps within the process, we can see whether this job waited longer, was blocked, whether different stages of the process were repeated and reprocessed, and the real working time.
In general, the target is to reduce lead time and cycle time. Attention must be paid when using these two metrics; because the lead time of a job can be much longer than the cycle time. Therefore, an improvement of 50% in cycle time may not exceed 10% in overall lead time. So, it is important to be careful about where the actual improvement will take place.
Throughput
It shows how much work has been done for a certain time period. For example, it shows how many jobs have been completed in 1 week or 2 weeks. We can estimate the amount of work that can be done in the future by noting this number in a few time periods of the same length. Throughput may go down as the Lead Time declines. This may be because the Work In Progress limit is not selected carefully and kept too low.
Number of problematic and blocked jobs
Problematic jobs are an indication that the throughput fails to deliver the desired quality. Blocked jobs indicate that the flow is not smooth. A decline in the Lead Time is a good thing, but a decline in quality shows that the alarm bells are ringing. The period of one step waiting for a job from another step in the process can be measured and determining an increase in this period provides realistic feedback. We can keep the record of the number of problematic and blocked jobs for a certain period of time. These numbers are compared for the following same time periods.
End Date Performance
According to the promised dates, we can keep the record if a job has been completed or not. Thus, the reliability and credibility of the team can be revealed. This metric is calculated very easily by comparing the end date of the job with the promised date.
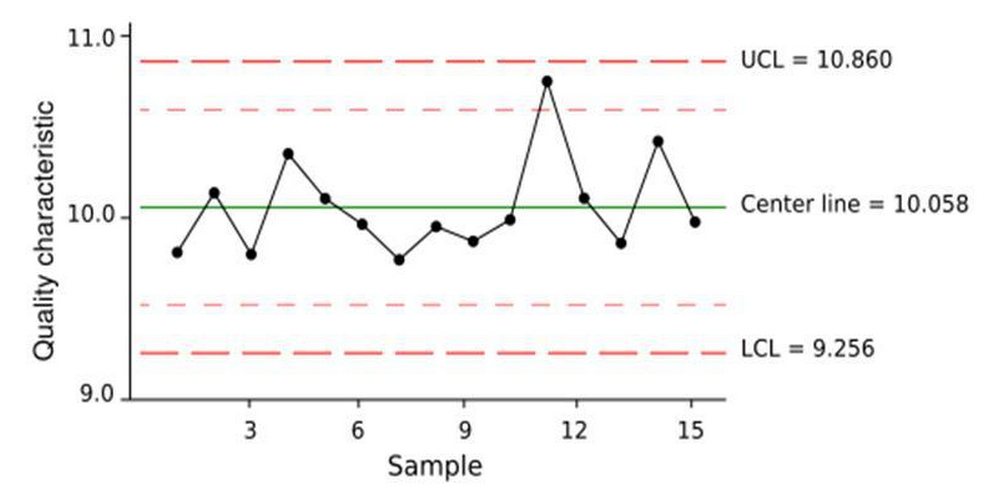
Statistical Process Control Diagram
Visualizing the lead times of all finished jobs by placing them on a chart makes it easier to determine the progress and jobs that are above expectation. In this graph, the vertical axis represents the lead time and the horizontal axis represents the time at which the job went live. The causes of deviations are investigated. Improvement measures are identified for these problems. Leaving the extreme lead times (outliers) apart, different interpretations can be made based on the average lead time, upper control limit, and lower control limit. For example, the small gap between the upper and lower control limits indicates a highly accurate lead time estimate. The downward trend of lead time shows that the improvements are working.
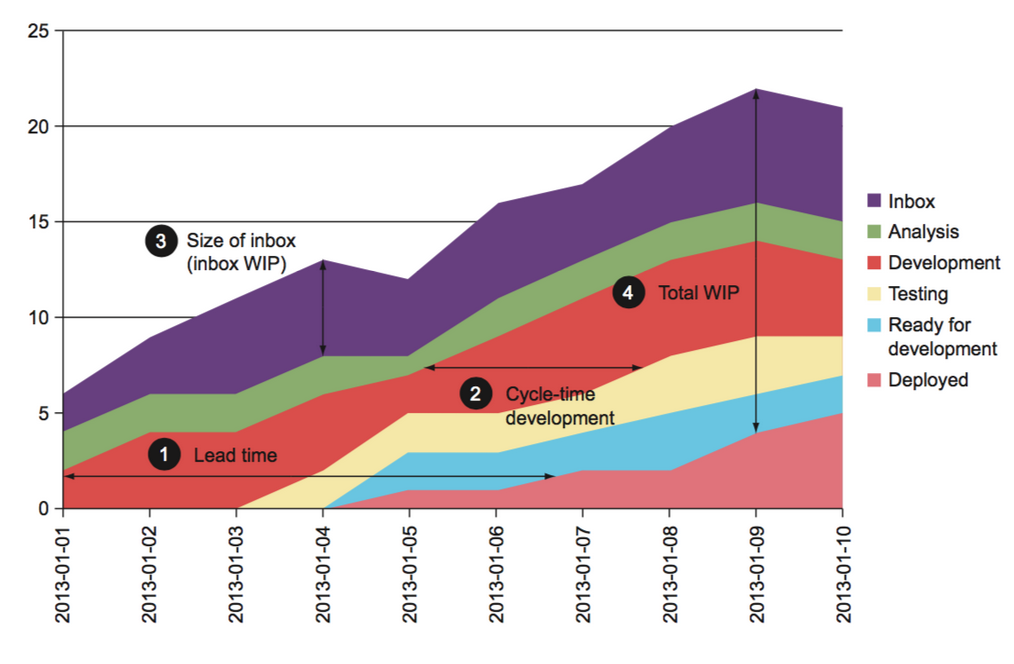
Cumulative flow diagram (CFD)
In order to draw the Cumulative Flow Diagram, the number of jobs in each column on your board should be posted daily and every day should be added to the previous day. A separate color is used for each column when drawing the CFD.
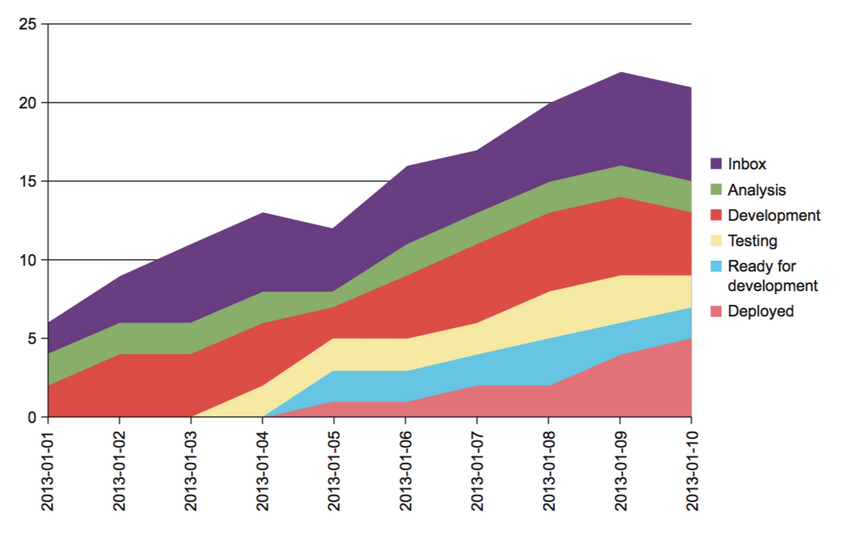
The following metrics can be calculated from this diagram:
- Lead Time
- Cycle Time
- Work in Progress
- Backlog Size
It should be kept in mind that the purpose of the team in using metrics is to measure the continuous improvement of the process, that the team has the freedom to determine their own metrics, and that these metrics should never be used to measure the performance of the team.